A Simple GUI for Liquidctl Fan Control
Author: Director, Akadata Ltd
Liquidctl is an excellent tool for controlling modern PC cooling hardware from the command line. However, for all its strengths, it lacks a convenient graphical interface to fine-tune fan and pump curves visually. This shortfall led to the creation of a lightweight Python-based GUI: a small but capable utility that brings drag-and-drop fan curve editing to life.
This GUI was built using tkinter for layout, matplotlib for graphing the curves, and numpy for the smooth Bézier transitions between temperature and speed points. It interfaces directly with liquidctl using simple subprocess calls and updates temperature readings live using sensors. The entire project remains under 300 lines of code and respects the system it runs on.
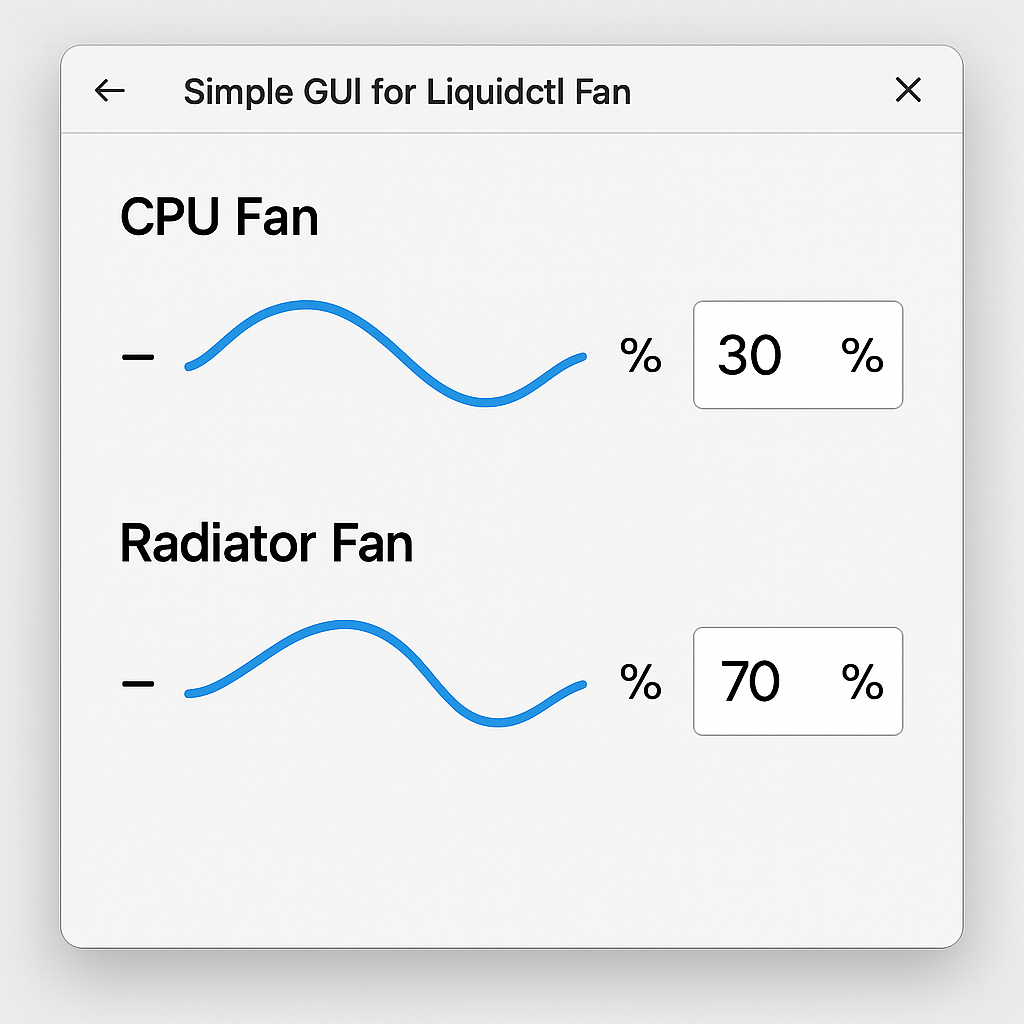
The purpose is not to replace advanced tools or dashboards, but to fill a specific usability gap: quickly and visually applying custom fan and pump curves for supported AIO and PSU devices using liquidctl.
Key Features:
- Graphical editing of both fan and pump curves
- Live system and temperature status updates
- Enforced monotonic fan curve design to prevent abrupt behavior
- Saving and loading from a JSON config under
~/.config/liquidctl_curves.json
This project exists to bring functional clarity, not fluff. It avoids bloated dependencies and serves its purpose plainly and clearly.
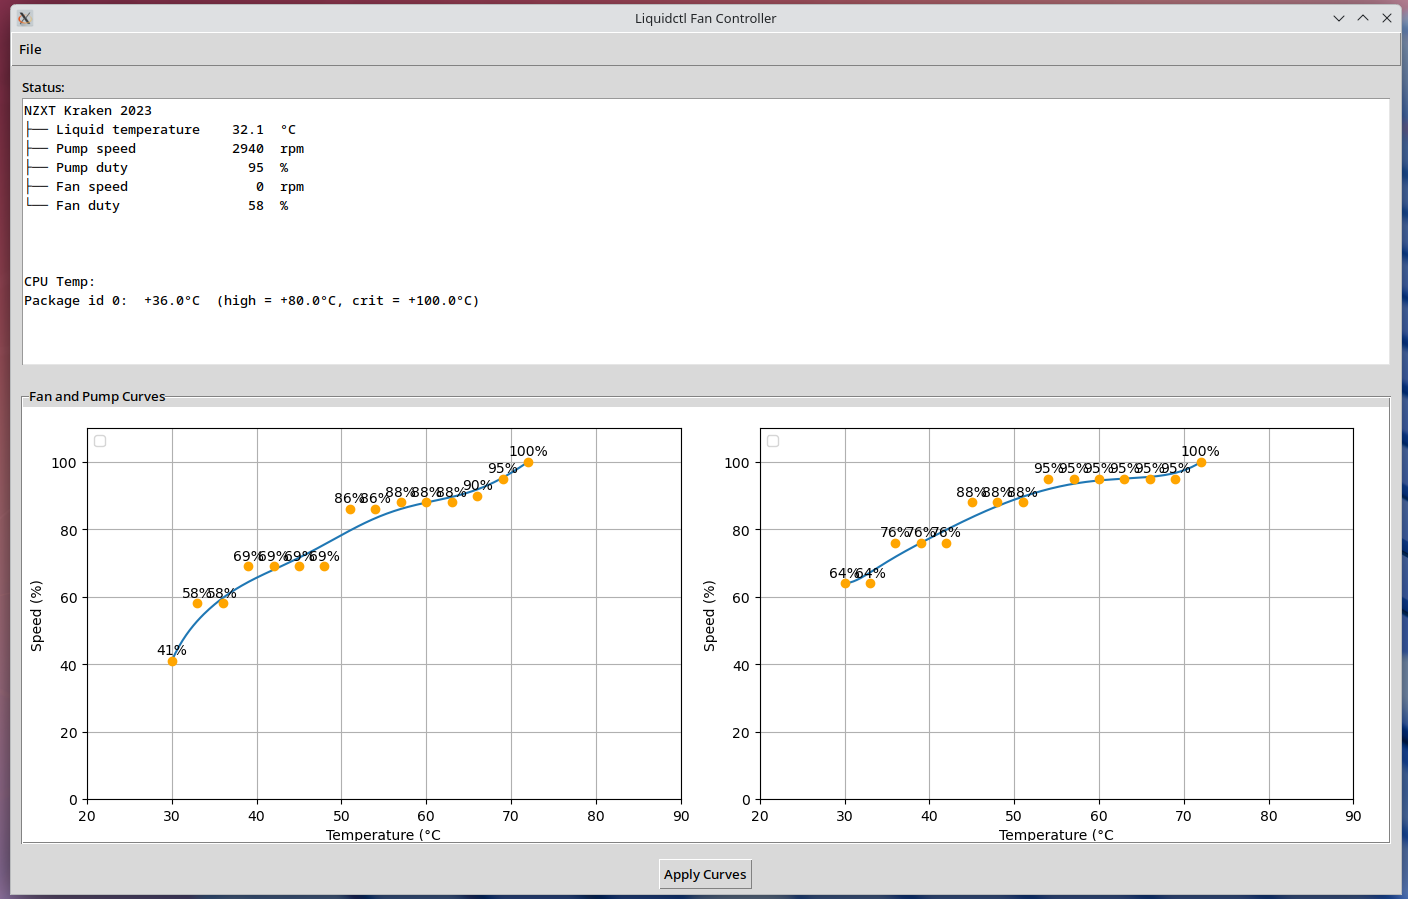
A screenshot and the script itself will be included below. Any who wish to improve or extend it may freely do so.
Source Code:
#!/usr/bin/env python3

import subprocess
import threading
import math
import tkinter as tk
from tkinter import ttk, messagebox, filedialog
import time
import numpy as np
import os
import json

try:
    import matplotlib
    matplotlib.use("TkAgg")
    from matplotlib.backends.backend_tkagg import FigureCanvasTkAgg
    import matplotlib.pyplot as plt
except ImportError:
    raise ImportError("matplotlib is required for graphical fan curve editing")

CONFIG_PATH = os.path.expanduser("~/.config/liquidctl_curves.json")

def get_status():
    try:
        output = subprocess.check_output(["/usr/bin/liquidctl", "status"], text=True)
        return output
    except subprocess.CalledProcessError as e:
        return f"Error: {e}"

def get_cpu_temp():
    try:
        output = subprocess.check_output(["sensors"], text=True)
        lines = output.splitlines()
        temps = [line for line in lines if "Package id 0:" in line or "Tctl:" in line or "CPU temp" in line]
        return "\n".join(temps)
    except subprocess.CalledProcessError as e:
        return f"Error reading CPU temp: {e}"

def apply_curve(fan_curve, pump_curve):
    subprocess.run(["/usr/bin/liquidctl", "set", "fan", "speed"] + fan_curve)
    subprocess.run(["/usr/bin/liquidctl", "set", "pump", "speed"] + pump_curve)

def refresh_status(text_widget):
    while True:
        status = get_status()
        cpu_temp = get_cpu_temp()
        full_status = f"{status}\n\nCPU Temp:\n{cpu_temp}"
        text_widget.config(state=tk.NORMAL)
        text_widget.delete(1.0, tk.END)
        text_widget.insert(tk.END, full_status)
        text_widget.config(state=tk.DISABLED)
        time.sleep(5)

def get_curve_from_plot(points):
    return [str(int(x)) for pair in points for x in pair]

def on_apply_plot():
    fan_vals = get_curve_from_plot(fan_points)
    pump_vals = get_curve_from_plot(pump_points)
    apply_curve(fan_vals, pump_vals)
    save_curve_config()
    messagebox.showinfo("Liquidctl", "Fan and pump curves applied and saved.")

def bezier_curve(points, n=200):
    points = np.array(points)
    x, y = points[:,0], points[:,1]
    t = np.linspace(0, 1, n)
    polynomial_array = [math.comb(len(x) - 1, i) * (1 - t) ** (len(x) - 1 - i) * t ** i for i in range(len(x))]
    curve_x = sum(p * xi for p, xi in zip(polynomial_array, x))
    curve_y = sum(p * yi for p, yi in zip(polynomial_array, y))
    return curve_x, curve_y

def draw_curve(ax, points, label):
    bx, by = bezier_curve(points)
    ax.clear()
    ax.plot(bx, by, label=label)
    ax.plot(*zip(*points), 'o', color='orange')
    ax.set_xlabel("Temperature (\u00b0C")
    ax.set_ylabel("Speed (%)")
    ax.set_ylim(0, 110)
    ax.set_xlim(20, 90)
    ax.legend(loc="upper left")
    ax.grid(True)
    for i, (x, y) in enumerate(points):
        ax.annotate(f"{y}%", (x, y + 2), ha='center')

def enforce_monotonic_curve(points):
    for i in range(1, len(points)):
        if points[i][1] < points[i - 1][1]:
            points[i] = (points[i][0], points[i - 1][1])

def propagate_change(points, idx, new_y):
    points[idx] = (points[idx][0], new_y)
    for i in range(idx + 1, len(points)):
        if points[i][1] < new_y:
            points[i] = (points[i][0], new_y)
    for i in range(idx - 1, -1, -1):
        if points[i][1] > new_y:
            points[i] = (points[i][0], new_y)

def on_press(event):
    global dragging_point
    for ax, points in ((ax1, fan_points), (ax2, pump_points)):
        if event.inaxes != ax:
            continue
        for i, (x, y) in enumerate(points):
            if abs(event.xdata - x) < 2 and abs(event.ydata - y) < 5:
                dragging_point = (ax, points, i)
                return

def on_release(event):
    global dragging_point
    dragging_point = None

def on_motion(event):
    if dragging_point is None:
        return
    ax, points, idx = dragging_point
    if event.inaxes != ax or event.ydata is None:
        return
    new_y = min(max(int(event.ydata), 0), 100)
    propagate_change(points, idx, new_y)
    enforce_monotonic_curve(points)
    draw_curve(ax, points, ax.get_title())
    canvas.draw()

def generate_even_points(start_temp=30, end_temp=80, count=15, base_speed=30, top_speed=100):
    step = (end_temp - start_temp) // (count - 1)
    return [(start_temp + i * step, base_speed + ((top_speed - base_speed) * i) // (count - 1)) for i in range(count)]

def save_curve_config():
    config = {
        "fan": fan_points,
        "pump": pump_points
    }
    os.makedirs(os.path.dirname(CONFIG_PATH), exist_ok=True)
    with open(CONFIG_PATH, 'w') as f:
        json.dump(config, f)

def load_curve_config():
    if os.path.exists(CONFIG_PATH):
        with open(CONFIG_PATH) as f:
            data = json.load(f)
            return data.get("fan"), data.get("pump")
    return None, None

def main():
    global ax1, ax2, fan_points, pump_points, canvas, dragging_point
    dragging_point = None

    root = tk.Tk()
    root.title("Liquidctl Fan Controller")

    menubar = tk.Menu(root)
    filemenu = tk.Menu(menubar, tearoff=0)
    filemenu.add_command(label="Save Curves", command=save_curve_config)
    filemenu.add_command(label="Quit", command=root.quit)
    menubar.add_cascade(label="File", menu=filemenu)
    root.config(menu=menubar)

    status_frame = ttk.Frame(root)
    status_frame.pack(fill=tk.BOTH, expand=True, padx=10, pady=10)

    status_label = ttk.Label(status_frame, text="Status:")
    status_label.pack(anchor=tk.W)

    status_text = tk.Text(status_frame, height=12, width=70, state=tk.DISABLED)
    status_text.pack(fill=tk.BOTH, expand=True)

    curve_frame = ttk.LabelFrame(root, text="Fan and Pump Curves")
    curve_frame.pack(fill=tk.BOTH, expand=True, padx=10, pady=10)

    loaded_fan, loaded_pump = load_curve_config()
    fan_points = loaded_fan if loaded_fan else generate_even_points()
    pump_points = loaded_pump if loaded_pump else generate_even_points(base_speed=40, top_speed=100)

    fig, (ax1, ax2) = plt.subplots(1, 2, figsize=(10, 4))
    fig.tight_layout()
    ax1.set_title("Fan Curve")
    ax2.set_title("Pump Curve")
    draw_curve(ax1, fan_points, "Fan")
    draw_curve(ax2, pump_points, "Pump")

    canvas = FigureCanvasTkAgg(fig, master=curve_frame)
    canvas.draw()
    canvas.get_tk_widget().pack(fill=tk.BOTH, expand=True)

    canvas.mpl_connect('button_press_event', on_press)
    canvas.mpl_connect('motion_notify_event', on_motion)
    canvas.mpl_connect('button_release_event', on_release)

    apply_button = ttk.Button(root, text="Apply Curves", command=on_apply_plot)
    apply_button.pack(pady=5)

    threading.Thread(target=refresh_status, args=(status_text,), daemon=True).start()

    root.mainloop()

if __name__ == "__main__":
    main()
To install requirements:
sudo pacman -S python-matplotlib tk lm_sensors liquidctl python-numpy python-json python-time python-math
Ensure liquidctl is accessible at /usr/bin/liquidctl, or modify the path in the script if needed.
For those managing thermal behavior with dignity and precision, this little tool may serve well.
All things built with purpose, all code under Heaven.